InstaOptions platform related Queries
Q1: How does InstaOptions ensure timely order execution?
InstaOptions allows for instant order execution, ensuring that traders can execute orders in real time without any delay.
Q2: Does InstaOptions provide Intraday Open Interest data?
Yes, InstaOptions provides intraday open interest (OI) data. This data can be useful for understanding the level of activity in a particular options contract and for identifying potential trading opportunities. InstaOptions intraday OI data is updated every 3 minutes, so you can always be sure that you have the most up-to-date information.
Q3: Do you offer real-time options chain data in InstaOptions?
Yes, InstaOptions offers real-time options chain data.
The real-time options chain data includes the following information: Strike price, LTP, IV, Greeks, OI (Change), and PCR.
Q4: Does InstaOptions have a Basket Order feature?
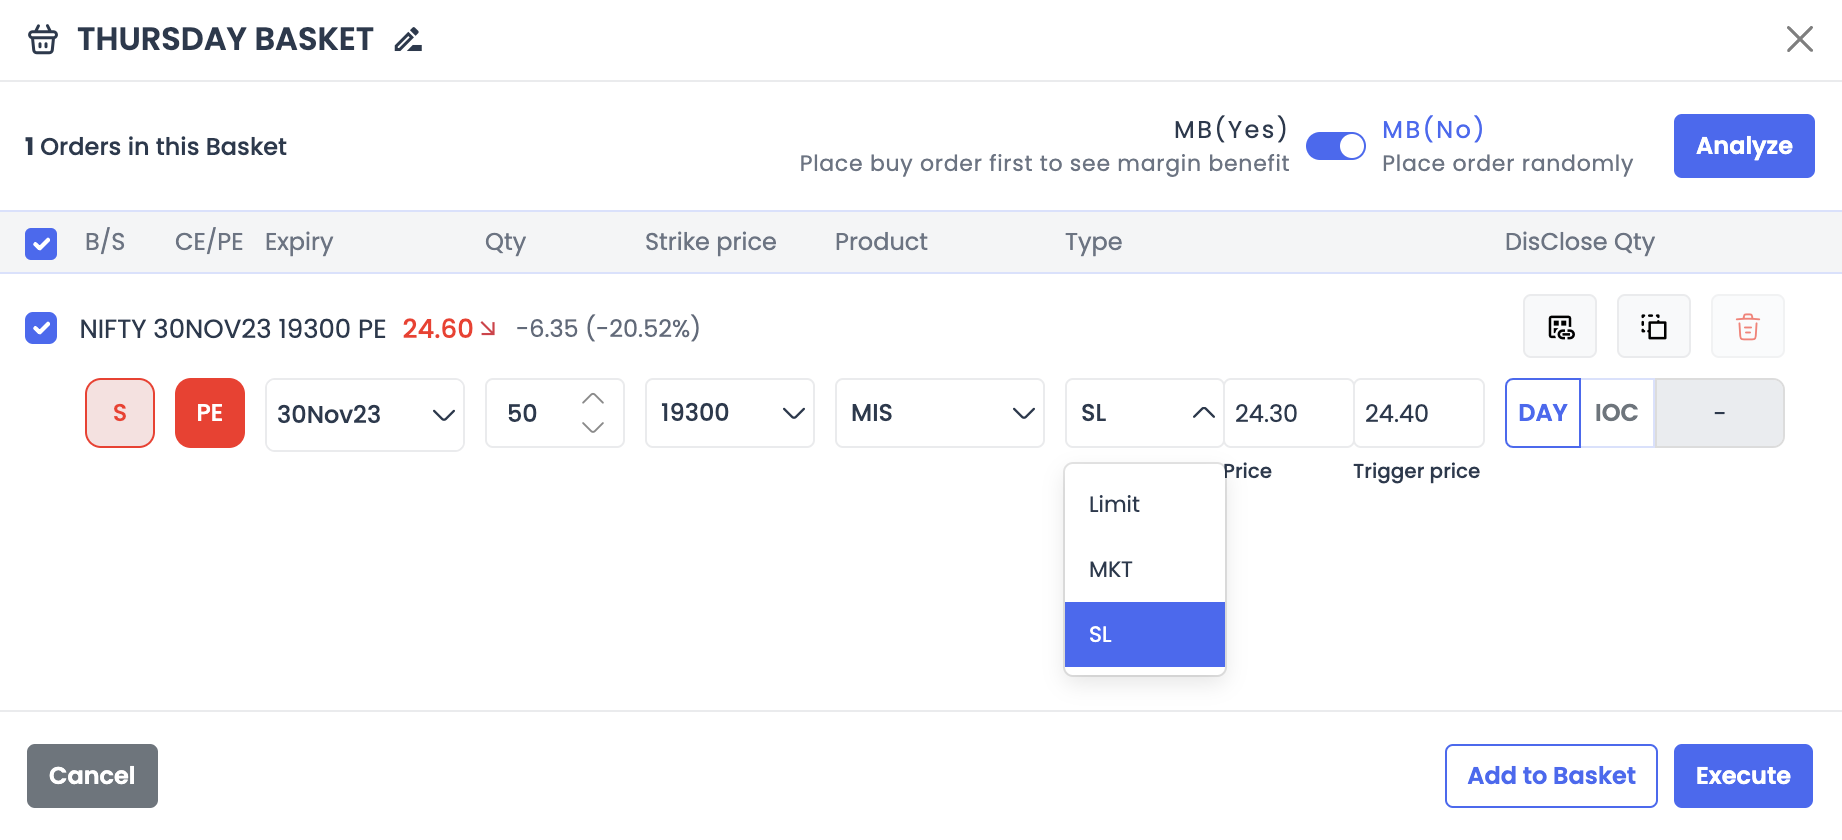
IntaOptions has a basket order feature. This feature allows you to place multiple orders at the same time. This can be useful for executing complex options strategies or for entering and exiting positions quickly.
To use the basket order feature, simply add the orders you want to place to your cart. Then, click the "Execute" button. InstaOptions will send all of the orders to your broker at the same time.
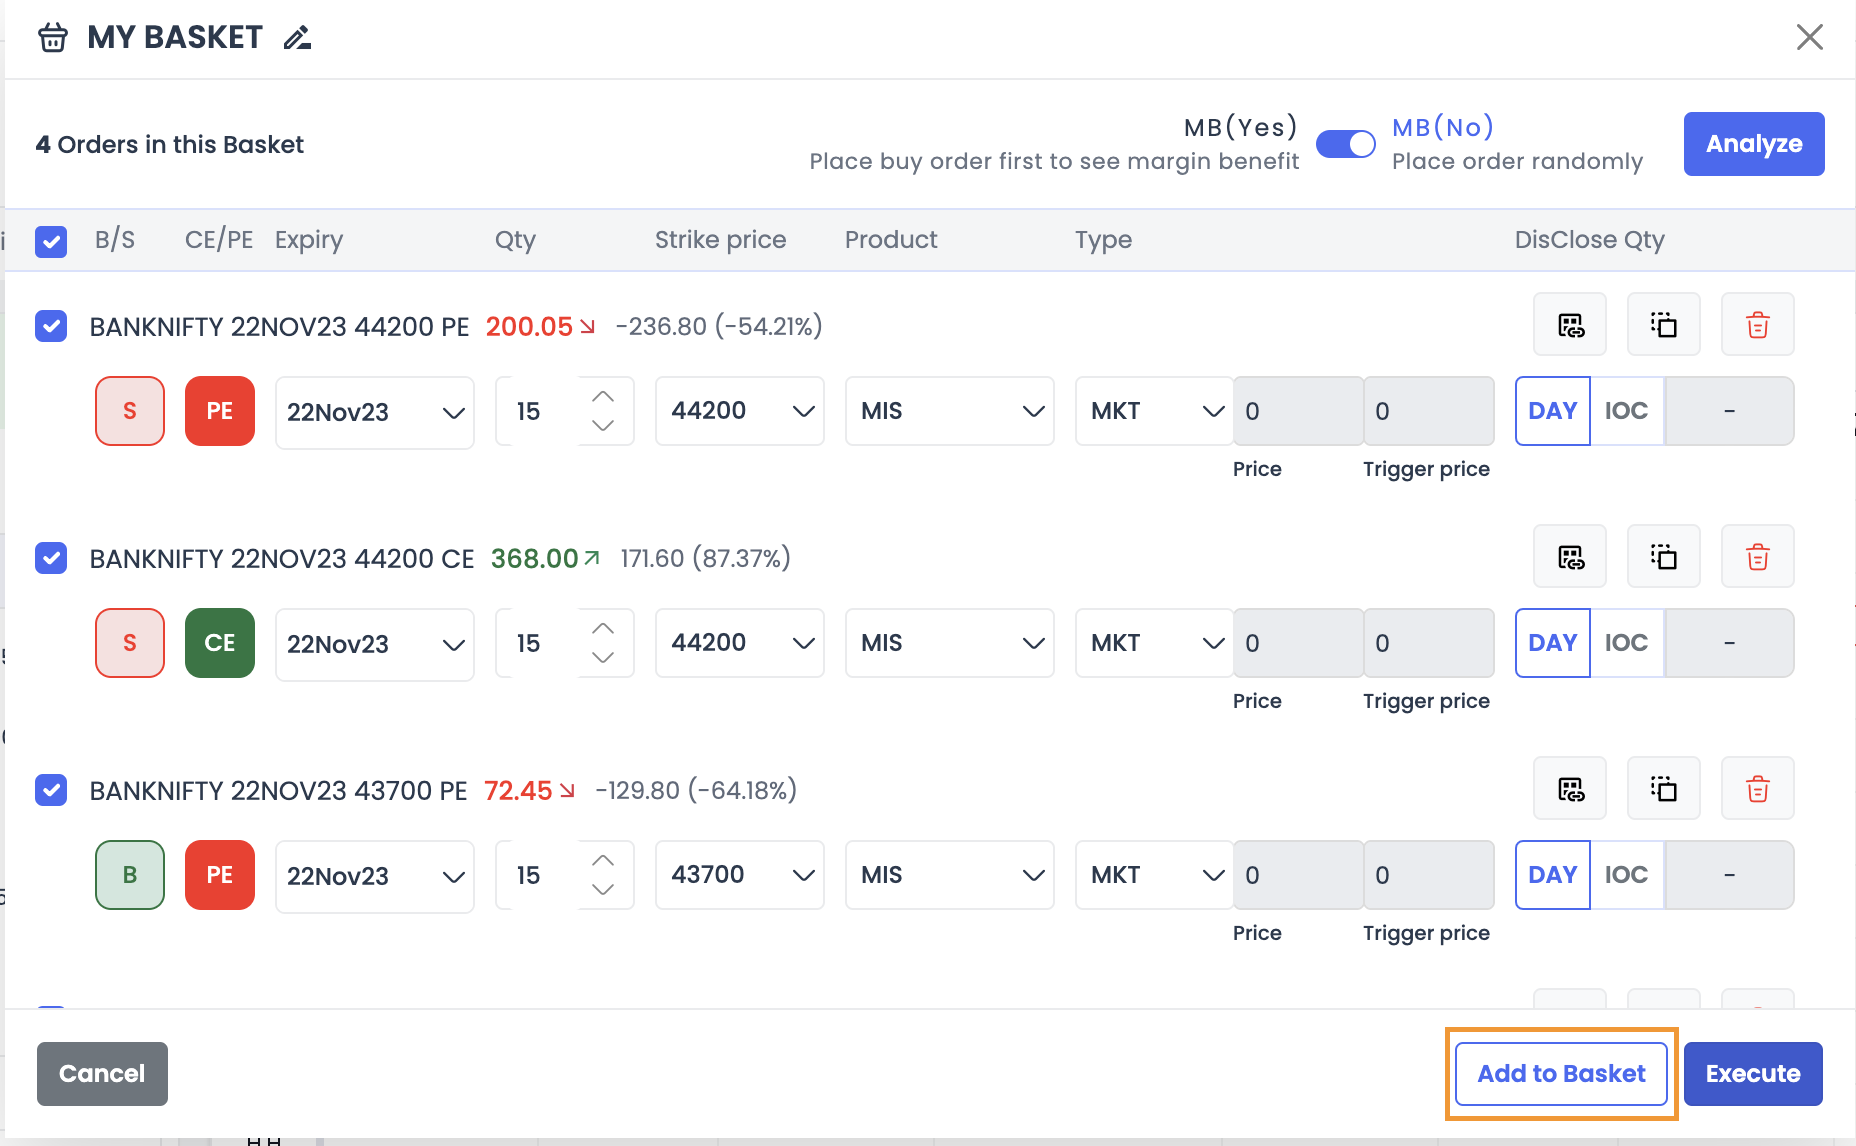
To save any strategy as a Basket -> Click on the ‘’Add to Basket” button on the Order Execution page (As shown in the screenshot above)
Q5: Does InstaOptions offer charting features?
InstaOptions allows you to see individual or combined premium charts for different options, and you can also add multiple indicators for technical analysis.
Q6: In InstaOptions do we get an option to execute buy legs before sell legs?
To get margin benefit, you should execute the Buy leg first and then Sell. While squaring off, you should exit Short leg first and then square off Buy leg.
At InstaOptions, users have the flexibility to either secure margin benefits by first executing the Buy leg followed by the Sell leg or place orders randomly according to user preferences.
Q7: Can I place SL Orders from InstaOptions? Also, Can I modify or cancel my pending limit orders placed through InstaOptions?
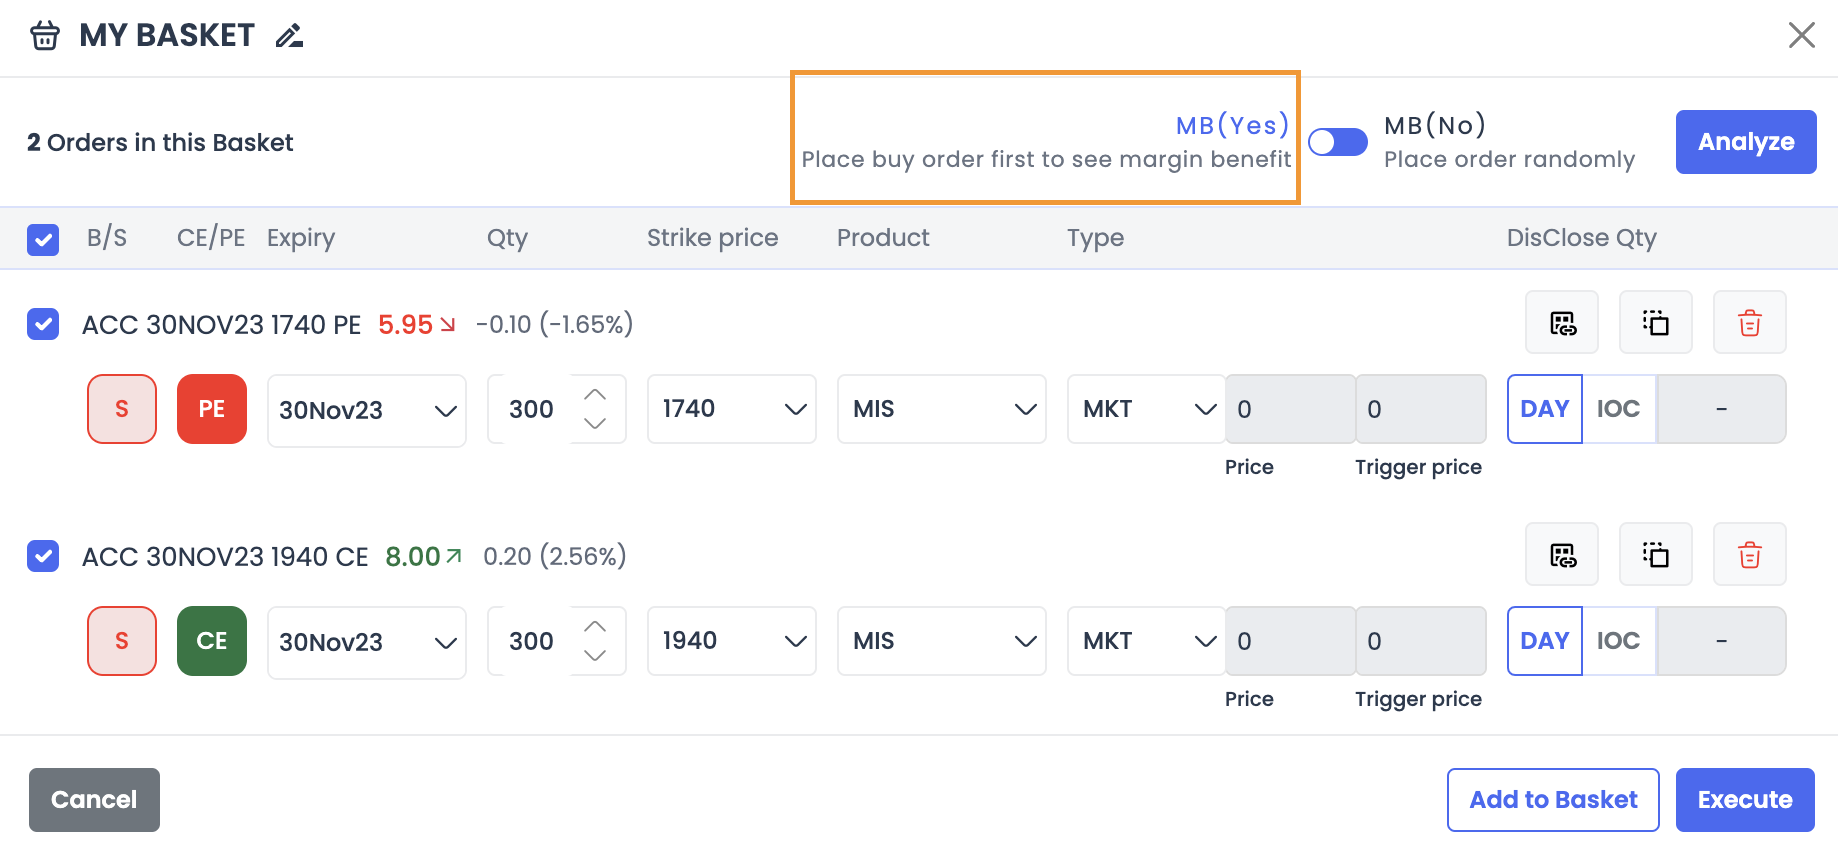
Yes, you can directly place stop-loss (SL) orders from InstaOptions.
To create an SL order in InstaOptions, follow these steps:
● Go to the Positions Book tab.
● Select the position to which you need to create an SL Order
● Click on the Exit Button and Enter the Order Details (Qty / Product)
● Select the Trigger Conditions
● Click on the Execute Button
Order Modification & Cancellation:
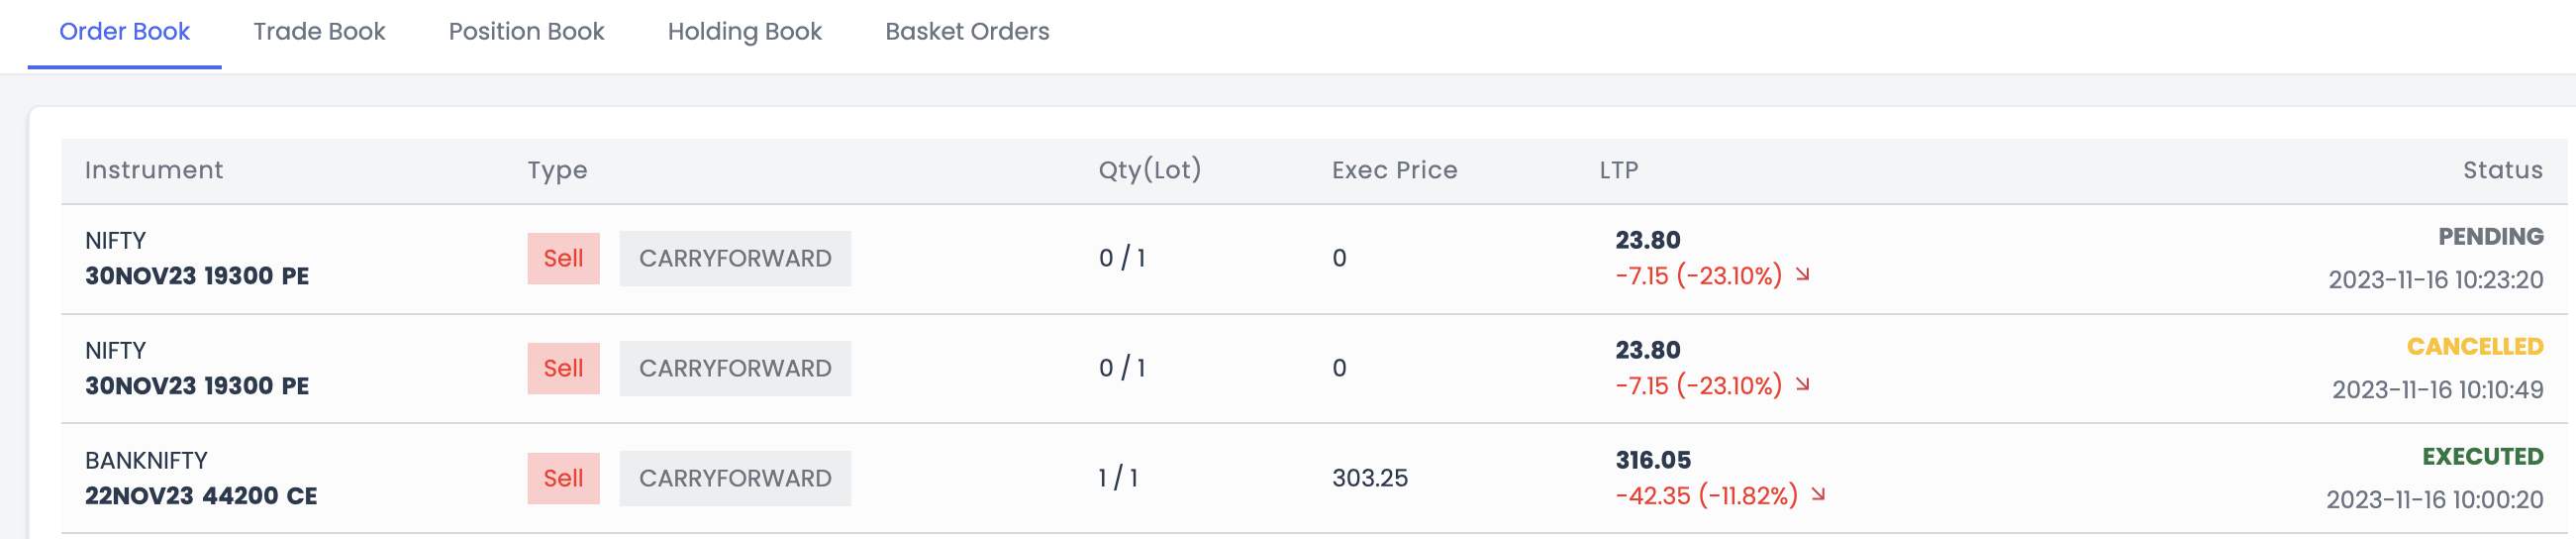
You can cancel your pending orders placed through InstaOptions. However, you won’t be able to edit or modify the pending orders as of now.
To cancel a pending order, follow these steps:
● Go to the Order Book tab
● Select the order with the status PENDING
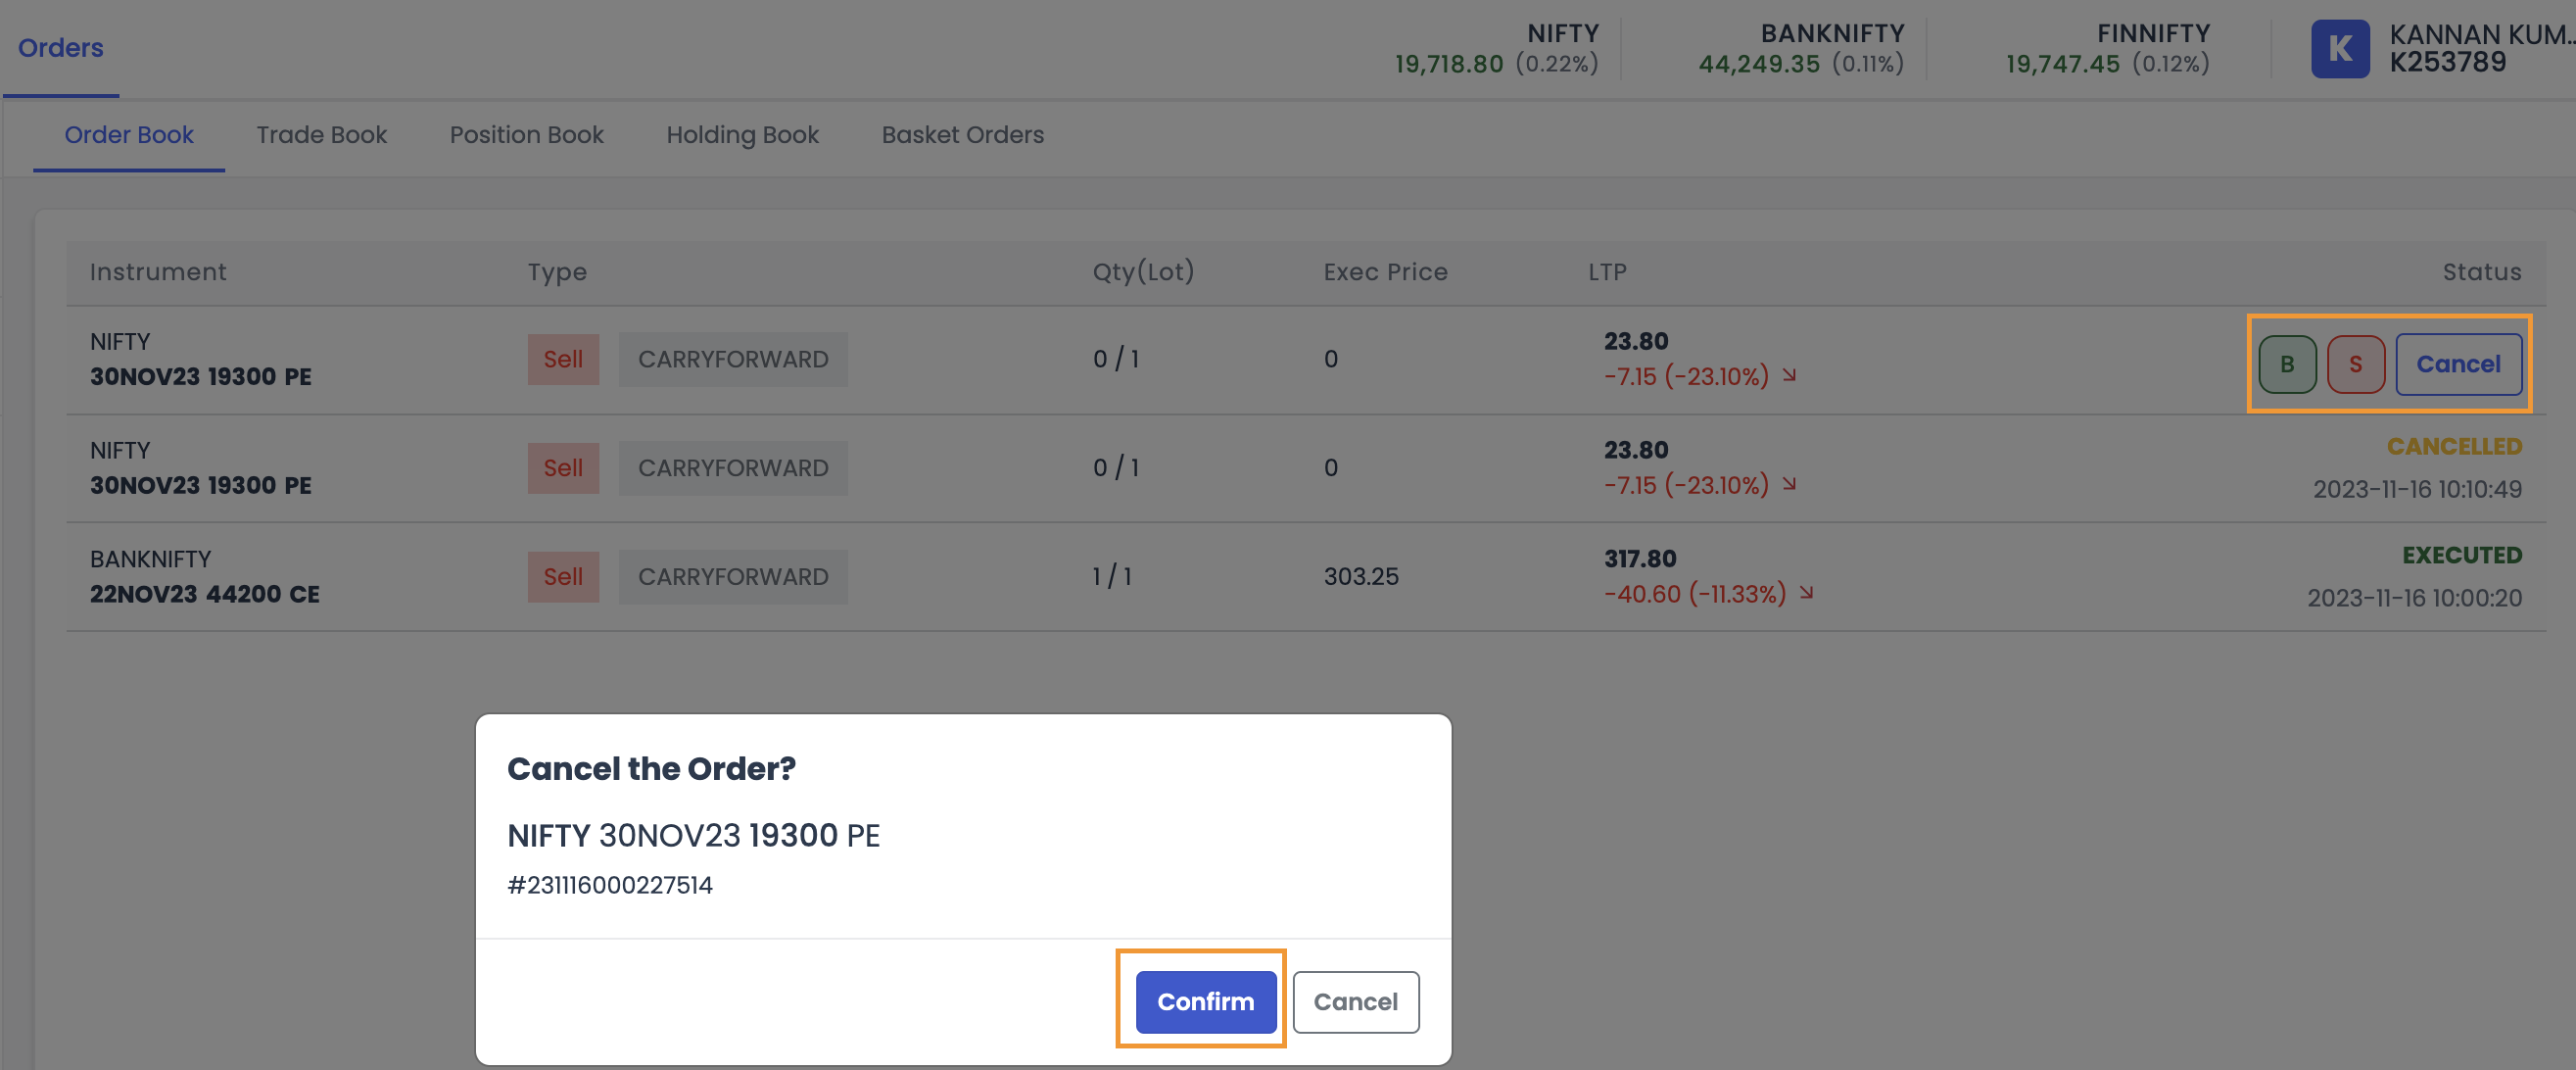
● You must select the Cancel button to open the cancel order window (Please note you can only cancel your Limit orders and cannot modify them for the time being)
● You need to confirm if you want to cancel the order, and the order gets canceled (please refer to the screenshot below).
Q8: Can InstaOptions assist me in identifying the best strategies?
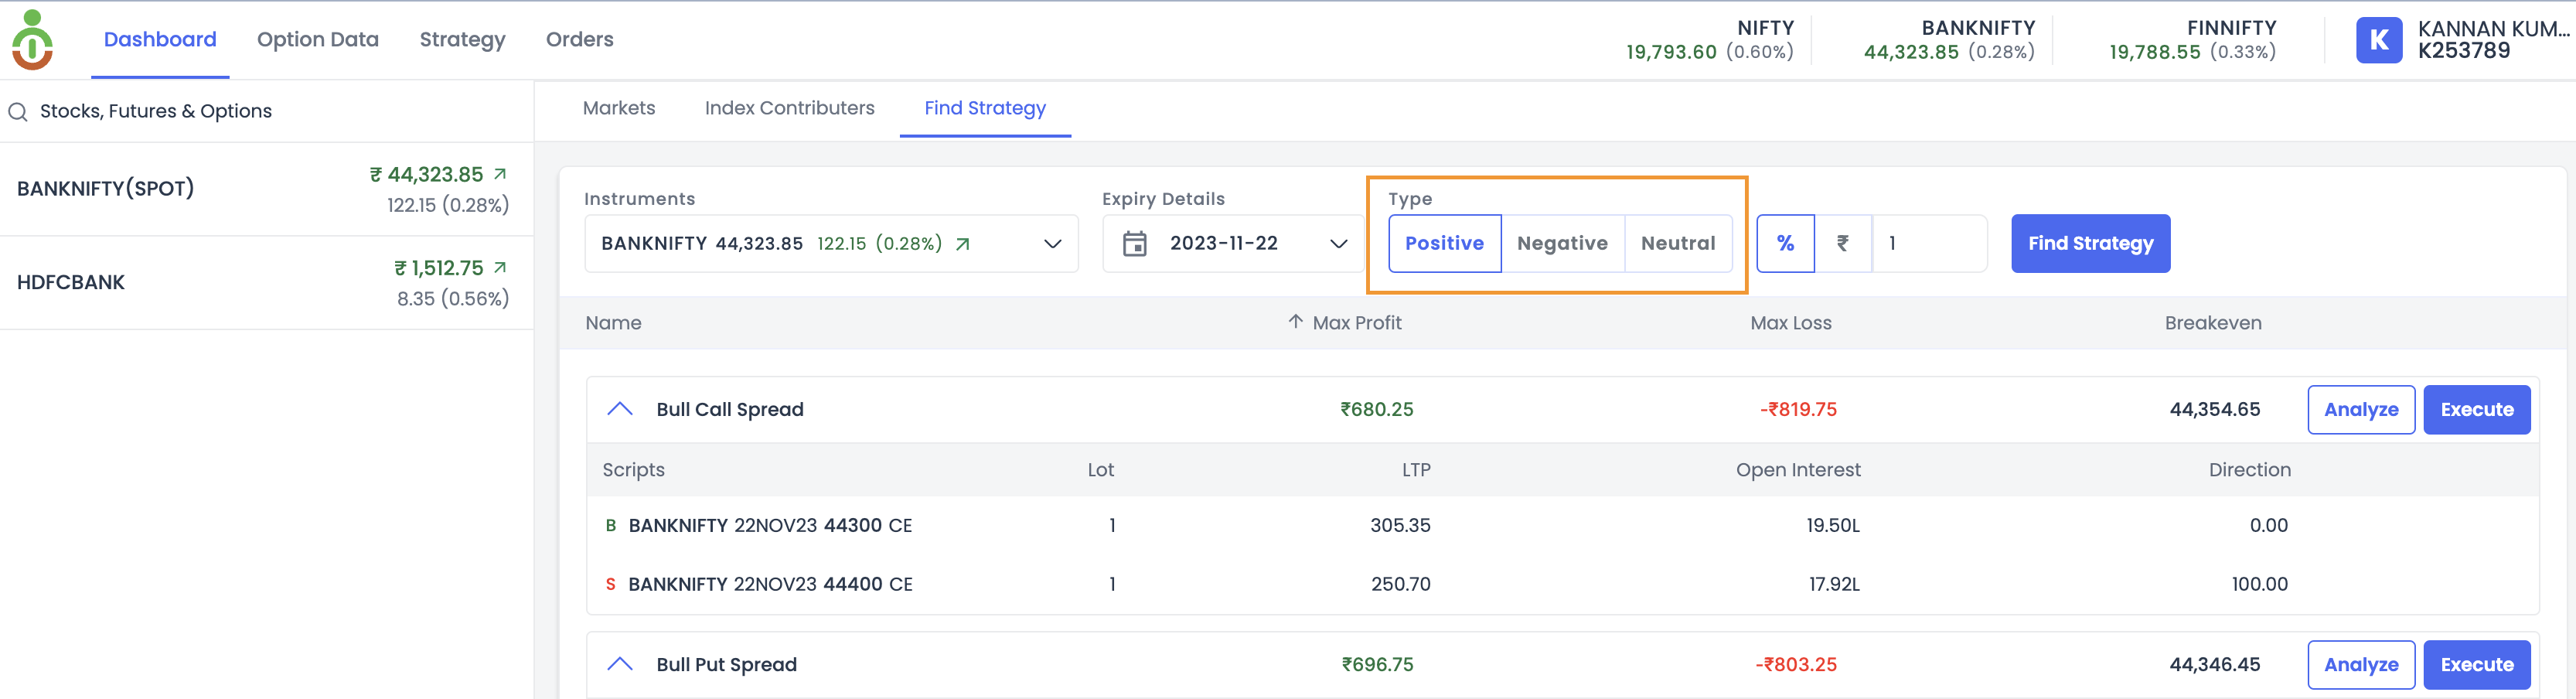
Certainly. InstaOptions provides a Smart Strategy Finder feature for users. Users only need to select their market view, whether it's Positive, Negative, or Neutral. Once the user makes a selection, InstaOptions will present a list of the most suitable strategies along with essential details such as Maximum Profit, Maximum Loss, and break-even. Users can then choose strategies based on their risk appetite.
Q9: Will my real P&L match the projected values in the Strategy builder?
In the Strategy Builder, the profit and loss are projections, and they depend on premium, liquidity, IV, etc. While we make the best effort to ensure they are right, the actual numbers may vary.
Q10: Is the order slicing feature available on InstaOptions?
At the moment, the order-slicing feature is not available. Nevertheless, we are actively working on incorporating this functionality in the near future.
What is Order Slicing?
With this feature, you can place orders above the freeze limit, and your orders will get automatically broken down into slices that can be executed more easily. This can be useful for executing large orders without moving the market price too much.
Q11: What is the Combined Premium Chart?
This chart shows the combined premium of two or more options contracts. The chart is typically created by adding the premiums of the individual options contracts together.
This can be useful for traders who are interested in comparing the premiums of different options contracts or who are looking for a way to track the overall cost of a particular options strategy.
InstaOptions will allow traders to add multiple options contracts to a single chart and to calculate the combined premium of those contracts.
Q12: Is InstaOptions beneficial for traders using combined premium charts?
Certainly! InstaOptions is the ideal platform for traders who use combined premium charts with different technical indicators for their trade setup.
Q13: How Indicators on the Combined Premium Chart can be beneficial?
Indicators on a combined premium chart can be beneficial in a number of ways. First, they can help traders to identify trends and patterns in the premium data. This can be helpful for traders who are trying to time their trades or who are looking for trading opportunities.
With InstaOptions, Users can now be able to add technical indicators on the Combined Premium Chart for a more versatile analysis of Premium behavior.
14.How are the OHLC values calculated for combined premium chart candles in InstaOptions?
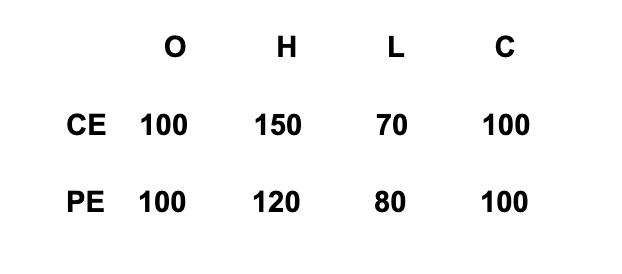
Here, we'll provide a detailed explanation of how OHLC values are derived for a combined premium chart on a minute-by-minute basis, using a hypothetical example based on the premiums of call (CE) and put (PE) options with a strike price of 44,000 (Banknifty).
The Combined Premium of both the call and put options is calculated by adding their respective premiums. It's important to note that the premium of call options tends to increase with a rising underlying asset value, while the premium of put options typically decreases.
Let's illustrate this process with an example:
9:30 AM:
Assume Both CE & PE Premiums open at 100. Combined Premium Opens = 200
Scenario 1:
Underlying Value Increases by +0.25%
Call Option Premium = 150 Put Option Premium = 80 Combined Premium = 230
Scenario 2:
Underlying Value Decreases by -0.25%
Call Option Premium = 70 Put Option Premium = 120 Combined Premium = 190
9:31 AM:
Assume Both CE & PE premiums close at 100 Combined Premium = 200
From the above explanation, we can easily conclude the OHLC of the Combined Premium Chart.
Note: It's worth noting that as the premium of the call option (CE) rises, the premium of the put option (PE) tends to decrease.
Here, when the call option (CE) reaches a high of 150, the put option (PE) experiences a low of 80. Conversely, when the put option (PE) reaches a high of 120, the call option (CE) registers a low of 70.
Based on these scenarios, we can determine the OHLC values for the Combined Premium Chart:
Open (O): The opening value is the sum of the initial premiums of the call and put options, which is 200.
High (H): The highest point in the combined premium during the minute is determined by considering the high premium of the call option (150) and the low premium of the put option (80), resulting in a high of 230.
Low (L): The lowest point in the combined premium during the minute is determined by considering the high premium of the put option (120) and the low premium of the call option (70), resulting in a low of 190.
Close (C): The closing value is once again 200, as both the call and put options closed at 100 each.
In summary, OHLC values for the Combined Premium Chart are as follows:
Open (O): 200
High (H): 230
Low (L): 190
Close (C): 200
This is how the candlestick chart appears:
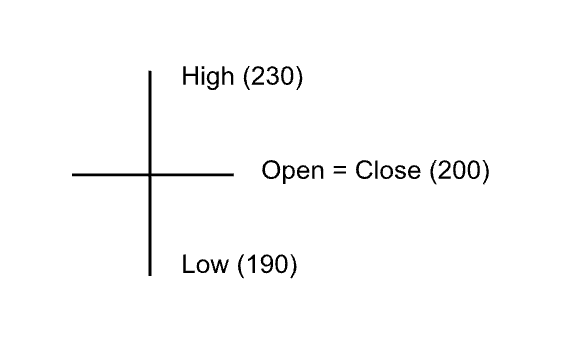
This OHLC data provides a concise representation of the minute-by-minute fluctuations in combined premium values, enabling traders and analysts to assess market dynamics and option pricing changes.
Q15: What is PCR?
PUT-CALL RATIO (PCR):
It compares the number of put options to call options traded on the market. (From the Seller’s perspective)
High PCR (> 1) means the puts are more in number than calls → Bullish
This means the option sellers are comfortable selling puts more than selling calls. This is a bullish sign. Having said that, an extremely high PCR, usually 1.3+ might mean an overbought stock and may result in a bearish reversal
Low PCR (< 0.5) means the puts are less in number than calls → Bearish
This means the option sellers are comfortable selling calls more than selling puts. This is a bearish sign. Having said that, an extremely low PCR, usually around 0.3 might mean an oversold stock and may result in a bullish reversal.
Q16: What is Cumulative OI?
Cumulative Open Interest (Cumulative OI) is the ongoing sum of all outstanding Options (Call and put) contracts.
Q17: What is Individual OI?
Individual Strike-wise Open Interest (OI) is the total number of open options contracts for a specific strike price of an underlying asset.
Q18: What is Cumulative OI Change?
Open interest change refers to the difference between the current open interest and the open interest from the previous trading session.
Q19: What is Individual OI Change?
Individual Strike-wise OI Change is the total number of changes in open contracts for a specific strike price for a specific time interval of an underlying asset.
Q20: How To Read Open Interest Graph?
If there is a big put OI on a strike, it acts as a Support.
If there is a big call OI on a strike, it acts as Resistance.
Q21: How To Read OI Change Graph?
Green bars on top half:
Calls Increasing at a strike → Sellers betting the market won’t go up → The strike to act as a resistance.
Green bars on the bottom half:
Calls decreasing at a strike → Sellers afraid the market might go up → Bullish signal.
Red bars on top half:
Puts Increasing at a strike → Sellers betting market won’t go down → The strike to act as a support.
Red bars on bottom half:
Puts decreasing at a strike → Sellers afraid the market might go down → Bearish signal.
Q22: What are Long Buildup, Long Unwind, Short Buildup, and Short Covering?
Long Buildup:
Price Up AND OI Up - Market participants are betting the stock will go up.
Long Unwind:
Price Down AND OI Down - Market participants are getting out of their long bets.
Short Buildup:
Price Down AND OI Up - Market participants are betting the stock will go down.
Short Covering:
Price Up AND OI Down - Market participants are getting out of their short positions.
Q23: How to Read Trending OI Graph?
The Trending OI feature calculates the cumulative OI change for the specified strike prices. It lets you see the options activity for any time interval you choose (up to 60min). Now you can see what exactly all the big guys are doing at any point in time.
Traders can use the Trending OI feature to identify the shift in momentum. This can be a good way to find potential trading opportunities.
Q24: How to Read Trending OI Sentiment Graph?
Trending OI Sentiment is nothing but the difference between the Chg. in Put OI & Chg. in Call OI (Put OI minus Call OI) for the specific strikes at specific time intervals.
If Call OI is significantly greater than Put OI, it suggests a more Bearish sentiment.
If Put OI is considerably higher than Call OI, it suggests a more Bullish sentiment.
Option sellers are big institutions, option buyers are small. Big guys are usually right. A build-up in Calls usually means big people are selling Calls, and are betting the market won't go up. A build-up in Puts means big people are selling Puts, and are betting the market won't go down. So a strike with a huge call OI will be resistance, and a strike with a huge Put OI will be support.
Q25: How to Read Pay Off Graph?
The Pay-off graph consists of pay-off at Expiry (Green and red Zone) and the current day pay-off called the Today Profit (blue line).
The green & red chart showing the profit area and loss area is the absolute pay-off that will happen if the option trade is held till expiry. This is Expiry pay-off.
The blue line is the potential pay-off that is possible as of that day (today).
Q26: What is Multi-Strike OI?
"Multi-Strike OI” Analysis in InstaOptions is a feature that allows traders to analyze open interest (OI) data for multiple strike prices of options at the same time.
It is a good indicator of market sentiment, as it shows how much money is being invested in a particular option contract. Multi-strike OI analysis can be used to identify trends and patterns in the market, as well as to identify potential trading opportunities.
Q27: Are there any brokerage charges associated with using InstaOptions alongside your broker login?
No, there are no additional brokerage charges for using InstaOptions. However, for trading, you will incur the standard charges as applicable with your broker, whether you execute trades through your broker's platform or directly through InstaOptions.